Avalanche Fatality Statistics: 2019-2020
The graphs below illustrate the seasons fatalities and fatal incidents according to different criteria. The first set shows the season in comparison to the previous 10 years, the second set categorizes the seasons recreational fatalities by different parameters.
We have archived 18 incidents with 22 fatalities for the 2019-20 season. Some sources list one additional accident which was part of an ice climb above climbers collapsing. While this did ultimately involve snow along with the ice it is a different hazard which climbers face. Mitigation and risk management for this is different than it is for avalanches.
For some of the graphs we have removed several incidents and included only recreational accidents outside of managed areas with mitigation. We removed 2 in-bounds ski area incidents and one roof avalanche and were left with 15 incidents and 17 fatalities. These are the seasons incidents in which the parties were responsible for making their own risk decisions and plans in the backcountry or "side country".
The seasons archived incidents can be found in the database now, members have full-featured searching and the general public can execute searches with some limitations.
Cumulative Statistics - Comparisons with last 10 seasonsClick on any graph for a larger version. |
|
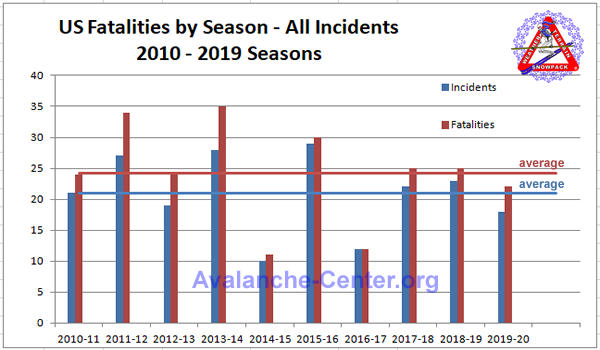 |
This graph shows the number of all avalanche incidents and fatalities for each of the past 10 seasons. The flat lines are the ten year averages. The 2019-20 season had slightly less than average incidents and fatalities. |
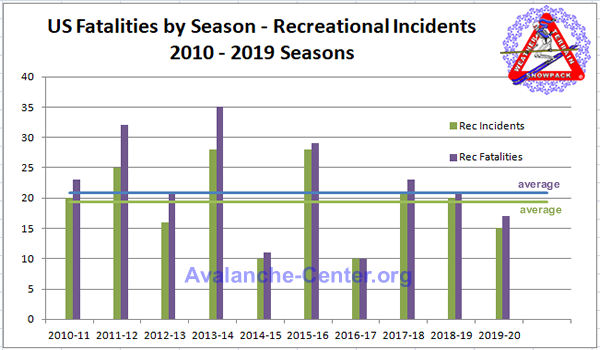 |
This graph shows the number of all recreational avalanche incidents and fatalities for each of the past 10 seasons. Ski area in-bounds incidents and roof avalanches have been removed from the data here so the numbers are a bit lower. The 2019-20 season has less that average incidents and fatalities, only two of the previous nine seasons had fewer. |
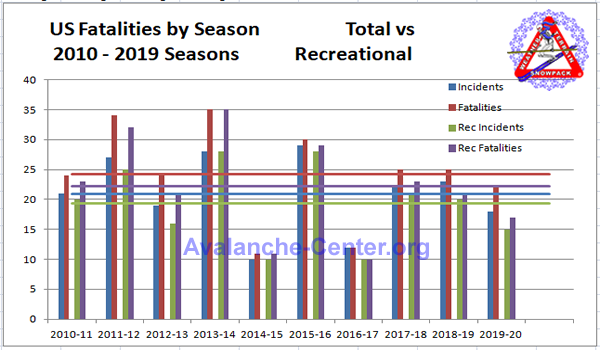 |
This is a composite of the above two graphs. This shows more directly the difference between all incidents and recreational ones only. |
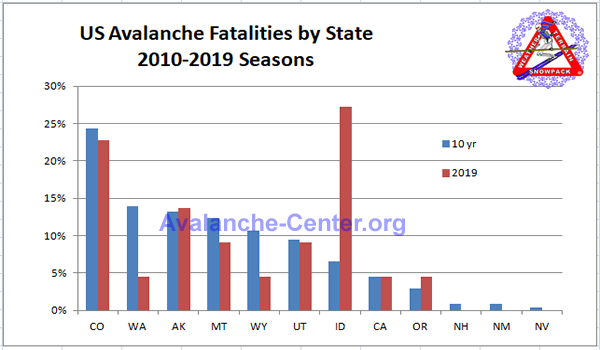 |
This graph shows the percentage of incidents in each state for the past 10 seasons (blue) and the 2019-20 season (red). Idaho had 3 ski area in-bounds fatalities, if those were left out it would be on a par with Alaska for the 2019 season. This graph has all incidents included, not only recreational. |
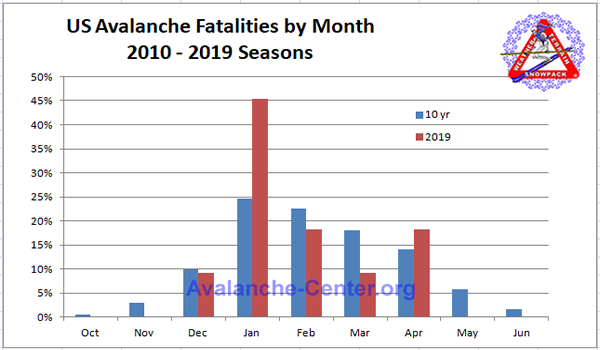 |
This graph shows the percentage of fatalities in each month for the past ten seasons (blue) and the 2019-20 season (red). It includes all avalanche fatalites. In the 2019 season May and June had none which may have been due to the covid pandemic. By May people were staying at home more, either by choice or due to restrictions. |
Graphs for Statistics of just the 2019 SeasonAll of the below graphs include only "recreational" incidents, meaning those where the party directly took personal responsibility for their activities, their rescue abilities, and the outcomes. Two in-bounds ski are incidents are omitted (one in California and one in Idaho) and one roof avalanche is also left out. One falling ice incident has not been counted as an avalanche death since this is a different hazard ice climbers face. It was not caused by an avalanche, the ice collapsed on its own for other reasons. The total number of incidents is 15 and the total number of fatalities is 17. |
|
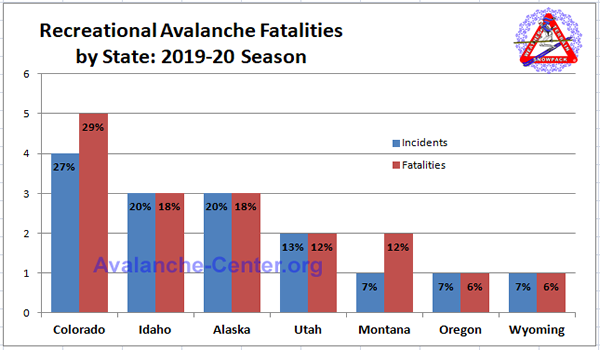 |
Colorado, with it's continental snowpack and high user-day figures, was the leader. This is typical. There were none in the maritime region, although one ski area incident (not included here) was in California and the roof avalanche was in Washington. The incident in Oregon was in the eastern part of the state, which has more in common with Idaho than the it does with the maritime Cascade range. (If the Oregon incident were added to Idaho it would be on a par with Colorado this year, plus an in-bounds incident not shown here which had 3 more fatalities.) |
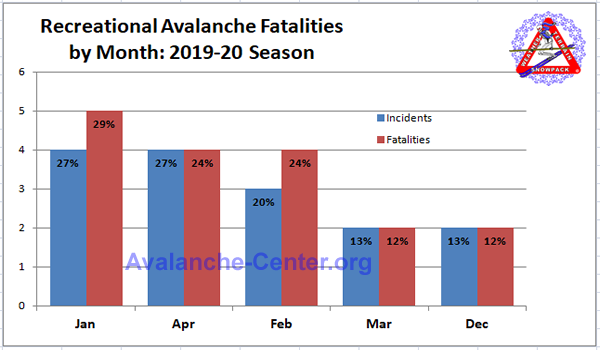 |
There is nothing too unusual in the monthly chart, although after April there were no more fatal incidents. Normally there would be a few in May and June but in 2020 the pandemic had picked up momentum by then and people were isolating at home. Either by choice or edict, depending on location. |
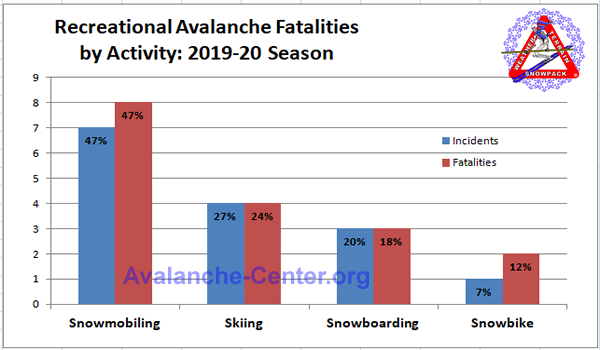 |
If snowbikes and snowmobiles are combined and compared to skiing and snowboarding the incidents are almost evenly split between motorized and non-motorized recreation. |
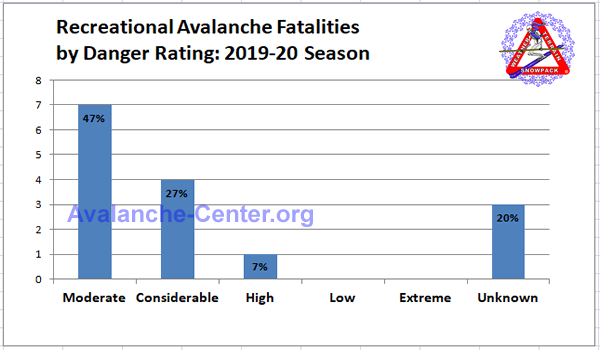 |
In three cases the danger level was not known because they were in regions without advisories. Of the other 12 most incidents, almost half, were during a declared Moderate danger scale level. |
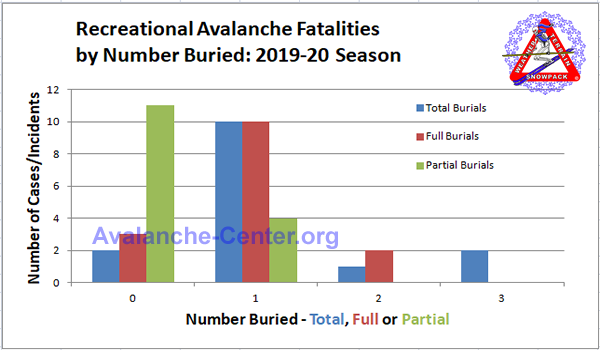 |
This chart shows the number of burials - full, partial and total. Only 2 incidents had 2 full burials, none had more although two had 3 total burials (in both cases 2 full and one partial). So during this season multiple burial incidents resulting in any fatality were not common. |

