Avalanche Fatality Statistics: 2020-2021
The graphs below illustrate the seasons fatalities and fatal incidents according to different criteria. The first set shows the season in comparison to the previous 10 years, the second set categorizes the seasons recreational fatalities by different parameters.
We have archived 29 incidents with 37 fatalities for the 2019-20 season. All could be considered recreational snow avalanche accidents, none involved ski areas, roof avalanches, or cases where an avalanche was a secondary factor. They are incidents in which the parties were responsible for making their own risk decisions and plans in the backcountry or "side country".
The number of fatalities was the highest in the last ten years by a small margin. (Two other seasons were close and a third not far behind those.) The number of fatal incidents tied for the highest, with two other seasons close. So this was one of four seasons out of the last ten with a similar number of fatal incidents. There were several multiple fatality incidents which is why there is a difference, and the other two similar years also had this feature.
The seasons archived incidents can be found in the database now, members have full-featured searching and the general public can execute searches with some limitations.
Cumulative Statistics - Comparisons with last 10 seasonsClick on any graph for a larger version. |
|
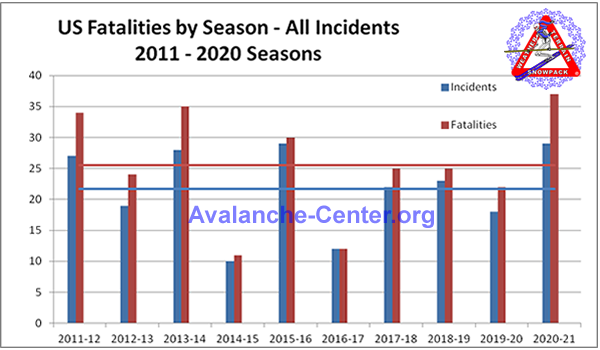 |
This graph shows the number of all avalanche incidents and fatalities for each of the past 10 seasons. The flat lines are the ten year averages. |
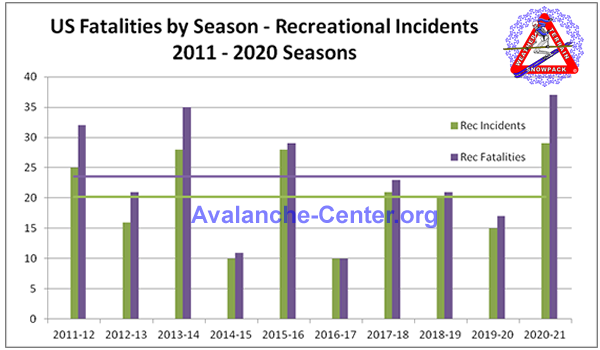 |
This graph shows the number of all recreational avalanche incidents and fatalities for each of the past 10 seasons. Ski area in-bounds incidents and roof avalanches have been removed from the data here so the numbers are a bit lower. |
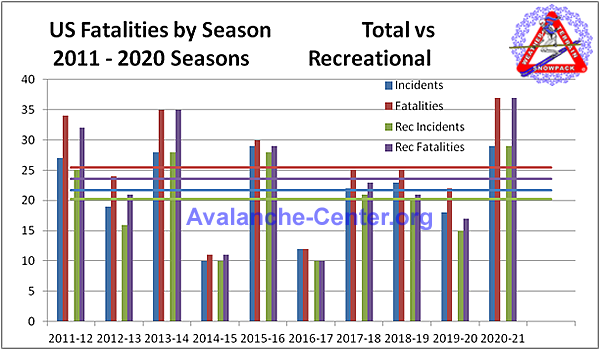 |
This is a composite of the above two graphs. This shows more directly the difference between all incidents and recreational ones only. During the 2020-21 season there was no difference, all incidents were recreational. |
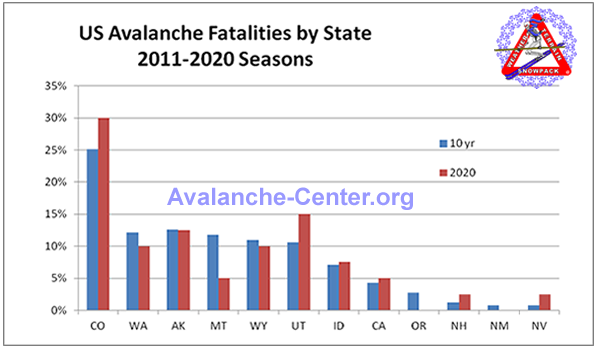 |
This graph shows the percentage of incidents in each state for the past 10 seasons (blue) and the 2020-21 season (red). This graph has all incidents included, not only recreational. |
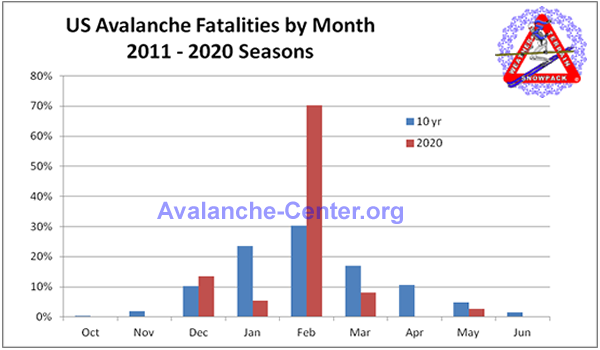 |
This graph shows the percentage of fatalities in each month for the past ten seasons (blue) and the 2019-20 season (red). It includes all avalanche fatalites. In 2020-21 an overwhelming majority happened in February, which was the result of the way the snowpack developed in the continental and transitional regions. It does not appear to have much to do with covid, unless the virus had some preference for February. |
Graphs for Statistics of just the 2020-21 SeasonAll of the below graphs include only "recreational" incidents, meaning those where the party directly took personal responsibility for their activities, their rescue abilities, and the outcomes. During this season all incidents fall into that category. The total number of incidents is 29 and the total number of fatalities is 37. |
|
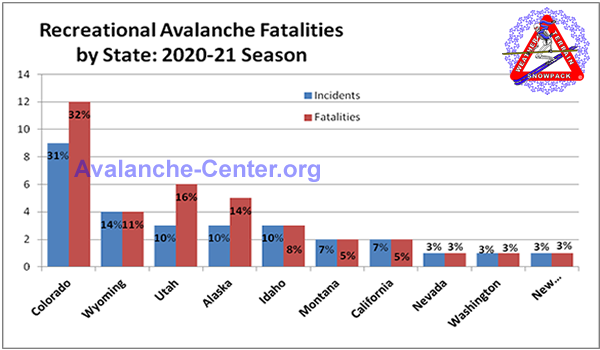 |
Colorado, with it's continental snowpack and high user-day figures, was the leader. This is typical. There were only five incidents in maritime regions, 2 in different regions of California, one in Washington, and 2 in Alaska. |
 |
This, along with the graph by state above, get to the heart of the matter. The snowpack was thin and weakening until it was loaded with new snow in late Jan or early Feb. Especially in CO but similar conditions existed throughout the mountain west. |
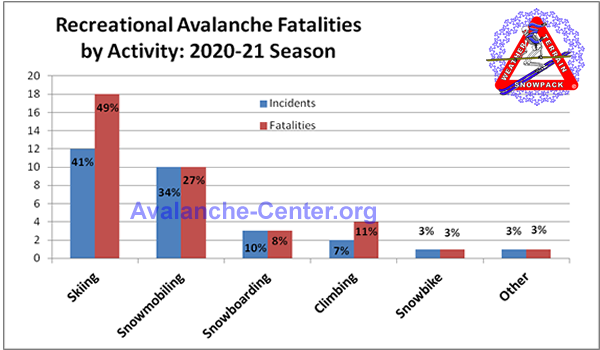 |
Non-motorized incidents and fatalities were greater this season than mechanized ones. Furthermore, all of the multi-victim incidents were non-mechanized. (Two involved skiing and one involved climbing.) |
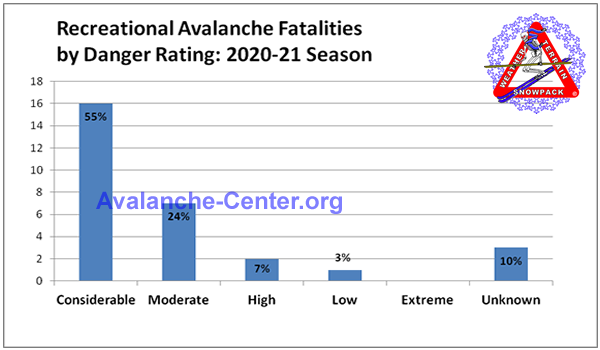 |
In three cases the danger level was not known because they were in regions without advisories. Of the other incidents most were during a declared Considerable danger scale level. One occurred during a Low danger in New Hampshire, which was a bit of a freak accident. |
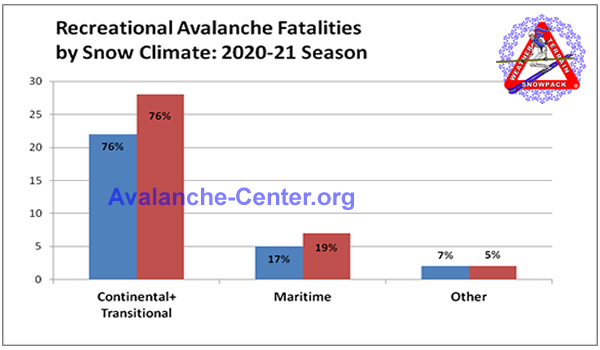 |
This chart shows incidents and fatalities by snow climate. Only 5 were in maritime areas, including 2 in AK deemed maritime. Two are considered "other" - one in NH and one May climbing incident that resulted from serac/ice fall rather than snow and was thus not related to climate. |

