US Avalanche Fatality Statistics: 2024-2025
The graphs below illustrate the seasons fatalities and fatal incidents according to different criteria. The first set shows the season in the context of the most recent 10 years, the second set categorizes the seasons recreational fatalities by different parameters.
The graphs in this section for each season are used in our annual publications, when this years edition is final it will be available in our store or at Amazon.
We have archived 19 fatal incidents with 22 fatalities in the US for the 2024-25 season. Four incidents (6 fatalities) could be considered non-recreational (i.e. professional) snow avalanche accidents - one ski patrol, one heli-ski incident, one cat skiing incident, and one privately guided trip. We consider recreational incidents to be ones in which the non-professional parties were responsible for making their own risk management decisions and plans in the backcountry or "side country". Commercial operations and guiding could be called recreational but differ in that professionals are responsible for risk management on behalf of the clients.
The seasons archived incidents can be found in the database now, members have full-featured searching and the general public can execute searches with some limitations.
Cumulative Statistics - In the context of the most recent 10 seasons
Click on any graph for a larger version. |
 |
This graph shows the number of all avalanche incidents and fatalities for each of the past 10 seasons. The flat lines are the ten year averages. This year was just slightly below the ten year average, but close. |
 |
This graph shows the number of all recreational avalanche incidents and fatalities for each of the past 10 seasons. One ski patrol fatality, two heli and cat skiing incidents, and one professionally guided incident have been removed from this seasons data here. For the previous seasons similar incidents as well as roof avalanches and other non-rec incidents were removed. |
 |
This is a composite of the above two graphs. This shows more directly the difference between all incidents and recreational ones only. During the 2024-25 season there was one ski patrol incident, one heli-ski incident, one cat skiing incident, and one privately guided trip incident. |
 |
This graph shows the number of incidents in each state for the past 10 seasons (blue) and the 2024-25 season (red). This graph has all incidents included. In this graph we see that AK had a typical number of fatal incidents during the 2024-25 season. |
 |
This graph shows the number of fatalities by state. Here we see that AK had more fatalities than average, despite the number of incidents being average. This is due to one incident with 3 fatalities. Oregon also had one incident with 2 fatalities and this shows up as a difference on this graph vs. the previous one. This graph has all incidents included. |
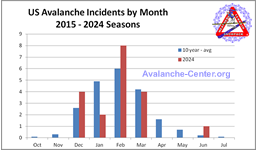 |
This graph shows the number of fatal incidents for each month in relation to the ten year average. There was a lull in January, above average in December and February, average in March, and that was the end of the season other than one in June. After April the average drops below one anyway. |
 |
This graph shows the number of fatalities each month each month in relation to the ten year average. The multiple fatality case (3 fatalities) shows up in March, which is above average here. |
 |
This graph shows the number of fatalities each month in relation to the ten year average as a percentage of the total. The percentage version can distort things a bit in some cases although this year the two graphs look pretty similar.
|
Graphs for Statistics of just the 2024-25 Season
Some of the below graphs include only "recreational" incidents, meaning those where the party directly took personal responsibility for their activities, their rescue abilities, and the outcomes. During this season all but four incidents fall into that category. One was a commercial heli-skiing incident and one was a cat skiing operation, where the operations are responsible for risk management. One was a professional ski patroller. And one was a professionally guided trip with a highly experienced guide. The total number of incidents is 19 and the total number of fatalities is 22 (or 15/16 recreational). |
 |
California had one ski patrol fatality, Alaska had one commercial heli-ski incident with three fatalities, Oregon had one commercial cat skiing fatality, and Utah had one professionally guided fatality. These incidents have been omitted here. |
 |
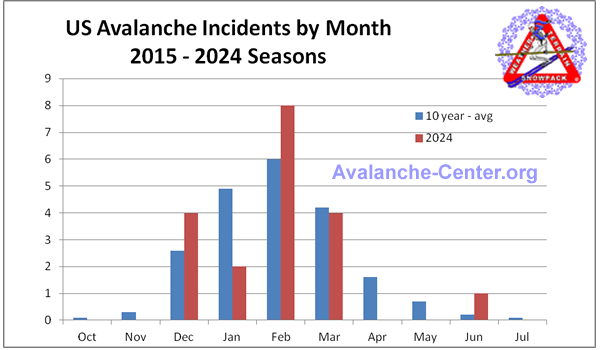
This graph includes all incidents, none are omitted. February had one incident with two fatalities and March had one (commerical) with three fatalities. |
 |
All incidents involved what could be called "traditional" avalanche risk activities. Minus climbing. Snow biking is a relatively new activity but can still be considered an activity with recognized avalanche risk. There were no snowshoers, hikers, x country skiers, etc (activities considered low risk in general for avalanches).
The "non-recreational" incidents are omitted in this graph. |
 |
Non-mechanized incidents and fatalities were significantly greater this season than mechanized ones, once again.
The four "non-recreational" incidents are omitted. Two of those were mechanized, two were on skis. |
 |
It is widely accepted (and perhaps established) that most fatal incidents (maybe most incidents in general) happen during Considerable danger. That was clearly the case this season. There were no advisories for one incident in Nevada and one on Denali.
The non-recreational incidents are not included here. Advisories with danger ratings are not intended for operational use by commerical/professional operations. |
 |
This chart shows incidents and fatalities by snow climate.
The commercial incidents are omitted - three were in maritime regions (CA, AK, OR) and the other was in Utah which is transitional. |


